
 图片仅供参考,以实物为准
- 名称:harvard精密微量注射泵控制软件
- 型号:harvard流量控制软件
- 品牌:harvard
- 类别:精密注射泵
- 公开报价:请电话咨询
- 销售咨询:010-63836252
产品详细介绍:
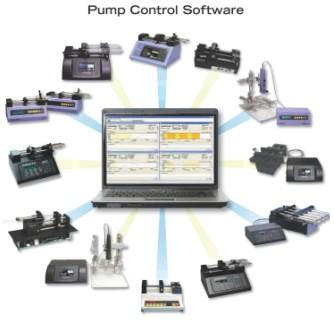
harvard精密微量注射泵软件
主要特点
单个或多个泵同时控制
轻松地创建简单的或更高级的方法
多步方法
多台泵运行在一个链或通过USB集线器
显示所有泵的运行参数
可控制相同或不同型号的泵
图形方式实时显示泵的进程
可打印数据
FlowControl™是一个易于使用您的PC上运行的软件程序
它的设计适用于所有哈佛仪器注射泵,有一个RS - 232包括或USB串行输入:pump11或更高级,此外,Nanomite,pump22,PHD22/2000系列,OEM模块的PHD ULTRA™和11型泵的精英系列。哈佛仪器的注射泵,有一个RS -232或USB串行输入包括:泵11先进,Nanomite,pump22,PHD22/2000系列,OEM模块和PHDULTRA™和pump11型泵的精英系列。

Single or Multiple Pump Control
FlowControl ™ has the ability to control single or multiple pumps.
Multiple pumps are controlled in a daisy chain or via USB hub. The
number of pumps allowed in a daisy chain is dependent upon the model.
Individual syringe pumps can be controlled by entering syringe data,
flow rate and choosing a flow direction (infusion or withdrawal). Flow
rate and flow direction can be changed while the pump is running.
FlowControl ™ allows you to create, review, edit, save, recall and
download Methods. You can create simple to complex Methods to
control one or more pumps individually or simultaneously.
Pump Status
The pump configuration screen tells you the status of all defined
pumps. If the light is green, the pump is ready. If the light is gray the
pump is off line. If the light is red the software is detecting the wrong
pump requiring you need to check your connection.
Pump Graph
In addition to the run time execution information in the Method
Execution window, FlowControl allows you to graphically monitor the
real flow progress of each independent pump in the Method Progress
window. The Method Progress screen displays all of the pumping
parameters for the individual pump in an easy to read format. This
allows you to monitor infuse and refill rates and volume dispensed.
Data Log
FlowControl creates a data log that tracks the activity of your pump
based on a specific Method. When a data log is created three different
files are generated with the same name but different extensions; excel
report (*.xls), bitmap report (*.bmp) and experimental notes (*.txt).
The bitmap report shows a screen shot of the pump flow evolution
chart from the Method Progress window. Experimental Notes are notes
typed in the Method Progress window by the user. The Excel report
provides details about the Method parameters.


